7/12/2013

New Book on Swedish Planning

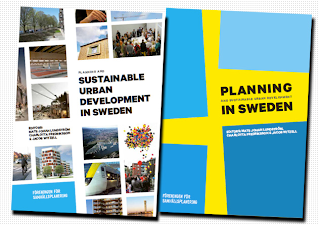
THE NEWLY PUBLISHED BOOK "Planning and sustainable urban development in Sweden" provides an overview of current trends in Swedish planning and urban development. The book addresses the Swedish planning system as well as projects and processes at national, regional and local level contributing to a sustainable urban development in Sweden. All articles are written by Swedish practitioners and researchers with insight into today's planning. I have written one article - Regional Planning in Sweden.
The book, published by the Swedish Society for Town and Country Planning (Föreningen för Samhällsplanering) in may 2013 can be ordered here.
Content
PART 1 - The Context of Contemporary Swedish Planning
- Planning in a New Reality - New Conditions, Demands and Discourses (Carl-Johan Engström & Göran Cars)
- A Competitive Local and Regional Milieu for Firms and People (Ulf Wiberg)
- Urban Policy and Strategic Urban Development (Charlotta Fredriksson)
PART 2 - The Swedish Planning System
- Planning Legislation in Sweden - a History of Power over Land-use (Gösta Blücher)
- Local Democracy and the Administrative System in Sweden (Eva Hägglund)
- Swedish Land-use Planning Legislation (Reigun Thune Hedström & Mats Johan Lundström)
- The implementation of Development Projects (Thomas Kalbro)
- Regional Planning in Sewden (Göran Johnson)
- Swedish Transport Planning - a New Deal in a New Reality (Susanne Ingo)
PART 3 - Social Perspectives on Planning
- Socially Sustainable Urban Development in Sweden (Micael Nilsson & Ulrika Hägred)
- On Urban Sustainability and Cultural Diversity (Åsa Dahlin)
- The Public Realm: the Renaissance of Urbanity (Thorbjörn Andersson)
- Communicative Planning Processes - Involving the Citizens (Johan Wänström)
- Housing and Housing Policy in Sweden (Bo Bengtsson)
PART 4 - Environmental Perspectives on Planning
- Planning for Sustainability: From Environmental Concern to Climate Change Measures, Attractiveness and Innovation (Kristina L. Nilsson)
- National Support For Environmentally Sustainable Development Activities on Local Level (Mats Johan Lundström)
- International Dissemination and Export of Swedish Know-how and Expertise in Sustainable Urban Development (Ulf Ranhagen)
... plus 15 examples of sustainable urban planning practices and projects around Sweden!

4/06/2012

The Future of Cities and Regions

The anthology ”The Future of Cities and Regions” is just about to be published by Springer. I have made a contribution to the book, titled ”Stockholm 2030”. It is the result of my participation in a workshop at the World Congress for Architects in Torino, Italy in 2008, where the use of models for prognosis and simulation at different levels of urban planning was discussed by professionals from different countries. It has taken some time to get the results published but now the book is published at last. Thanks Giuseppe och Luca for your work.
This guide for tomorrow’s urban practitioner systematically explains fifteen best practices across three continents; it explores questions of broad interest for designing and planning the future of cities and regions. Key questions addressed are: Is simulation useful to explore the effects of different design, policy and planning strategies? Which approach will help manage the uncertainties of metropolitan areas both today and tomorrow ? What are the strengths and weaknesses of the different simulation practices for city leadership, public and private partnership, and citizen involvement? The book reviews computer models and media, socio-political initiatives, professional practices which help communicating the future effects of different design, political and planning strategies with a wide range of aims: from information, through consultation, towards active participation. These world best practices are considered according to four leading issues for urban and regional development, respectively Simulation, Scenario and Visioning, Government and Governance, and Scale. The book examines the approaches adopted technically and procedurally. The selected knowledge and the innovative tools used in each case study are among the most advanced and up-to-date in the professional and research fields. This volume successfully illustrates these innovative practices and methodologies in a straightforward and accessible way.
My contribution is about the use of models in the work with the Regional Development Plan 2010 for the  Stockholm Region. This work was not completed at the time for the conference but long before the book was published.
The regional development plan for the Stockholm Region should meet the growth which was expected to occur in various areas during the next 30 years, e.g. the growing population and the increasing transportation needs. Since the regional plan is only a guideline and not binding the municipalities had to be voluntarily involved in the preparation. The physical structure is of great importance for the location of households and companies and the implementation of the plan. The successive creation and evaluation of alternative planning scenarios, describing the possible future land use and transportation structure, was a central part of the planning process. A number of forecasting and modeling tools were used for the creation and evaluation of these scenarios. Using GIS and Transport Models as tools can serve and facilitate the planning process and the dialogue with stakeholders as well as the understanding of future spatial scenarios. A number of environmental, economical and social impacts can be considered and evaluated comprehensively. A large number of alternatives can rapidly be evaluated, discarded or approved for further analysis. New alternatives and combinations of alternatives can be evaluated on demand from stakeholders.

5/07/2010

Urban Cooling in Pune, India

Fear of increasing summer temperatures in Pune, Maharashtra, India, being a threat has been expressed, a threat that has to be met and managed in one way or another. Summer temperatures over 40 degrees C are said to be normal nowadays, which was not the case 20 or 30 years ago. Eleven days in April 2010 have witnessed above 40 degrees Celsius temperature. The highest temperature of the season reached 41.5 degrees on April 16th. In total 24 days of April were above normal and only 6 days below normal. The city recorded its highest temperature of the 2009 season on April 20th with the mercury touching 41.6 degree Celsius. The highest April temperature recorded in the last 10 years in the city was 42.1°C on April 25, 2008. The highest-ever maximum temperature in the city was 43.3 degrees Celsius was recorded in April in 1897.
Climate and urban temperature
Discussing possible impacts of increasing summer heat it is essential to distinguish between climate and weather. Temperature is normally varying from day to day and from year to year but climate only change gradually and very slowly. Climate is often defined as the average weather conditions during a comparably long period of at least 30 years. High summer temperatures during 2008-2010 do not imply increasing summer heat.
It is also important to distinguish between global and regional climate changes from the situation on a specific weather station in one certain location. The commonly known fact that climate change implies a global warming of approximately 0.7oC during the last century, this fact tells nothing on the situation in a certain location like Pune. What is more important than global warming for the situation in an urban agglomeration of 5 million inhabitants like Pune is what internationally is known as the Urban Heat Island phenomenon, i.e. that the average temperature in an urban agglomeration is higher than the temperature in the surrounding rural areas.
Urban Heat Island Phenomenon
An Urban Heat Island (UHI) is a metropolitan area which is significantly warmer than its surrounding rural areas. A typical Urban Heat Island profile is showing highest temperature in downtown and clear low temperature in parks and surrounding rural areas. The main cause of the UHI is modification of the land surface by urban development which uses materials which effectively retain heat. Waste heat generated by energy usage is a secondary contributor. UHI has become more and more significant during the last 50 years, due to urban growth and increase in energy consumption in urban areas.
A typical Urban Heat Island profile showing highest temperature in downtown and clear low temperature in parks and surrounding rural areas.
It is very difficult to measure the real impact of UHI, since it is an effect of the location of the city, the local land use and the energy consumption in the city. However, the variations between tropical cities are quite high. Not all cities show a warming relative to their rural surroundings. Temperature data measured in urban weather stations around the world are generally adjusted, in an effort to homogenise the temperature record. Urban areas are heterogeneous, and weather stations are sometimes located in "cool islands" like parks within urban areas.
The urban growth of the city of Pune during the last century is remarkable. The population has increased from was slightly more than 100,000 in the year 1900 to more than 2.5 million 100 years later. Population in the total agglomeration of Pune and Pimpri-Chinchwad is now appr. 5.0 million inhabitants. Most of the population growth, the increased use of energy and the growth motorized traffic flows have occurred after 1950. The expected effect of UHI in Pune would be seen mainly during the second half of the 20th century and increasing until now.
Temperature in Pune
As mentioned already in the introduction of this paper temperatures in Pune is said to be increasing, and high summer temperatures has been registered during 2008-2010. The highest-ever maximum temperature in the city was on the other hand registered in 1897, more than 100 years ago.
The climate of the city is on the whole dry and invigorating. The mean monthly temperature is high (29.8 degrees C) in May while December witnesses a low (20.5 degrees C). However, the mean maximum temperature for April is (37.9 degrees C) more than that of May (37.2 degrees C).
The temperature in Pune has actually been decreasing, not increasing during the last 100 years, according to a recent study of temporal variation in temperature over Pune city, India, during the period 1901–2000 (Alaka Gadgil, Amit Dhorde, Temperature trends in twentieth century at Pune, India, Department of Geography, University of Pune, 2005.). The analysis reveals significant decrease in mean annual, mean minimum and mean maximum temperature.
Annual Mean temperature in Pune 1900-2000. Broken line showing 11-year running mean, unbroken line the linear trend.
This decrease in temperature is more pronounced during the winter season, which can be ascribed to a significant increase in the amount of suspended particulate matter (SPM) in the ambient air during the last decade. The summer mean temperature also shows a significant decreasing trend. However, unlike winter season this decrease is caused by significant fall in maximum temperature. The temperature during summer was higher during 1940’s to early 1960’s after which it has come down.
Summer mean temperature in Pune 1900-2000. Broken line showing 11-year running mean, unbroken line the linear trend.
On the contrary, monsoon season shows warming. This indicates that the night temperatures during recent years have gone up during monsoon. This warming can be attributed to a significant increase in the low cloud amount. Thus, all the trends are also well-supported statistically.
Monsoon mean temperature in Pune 1900-2000. Broken line showing 11-year running mean, unbroken line the linear trend.
The cooling trend in Pune’s temperature seems to be slightly accelerating. The conclusion can be made by comparing with other studies for Pune during the period 1876–1986. Contrary to this, the monsoon season shows warming trend. This may be due to significant increase in the low cloud amount during this season. Recently, anthropogenic aerosols are recognized as providing a significant and yet uncertain perturbation on the global radiation balance in terms of overall cooling effect. It is observed that SPM levels at Pune are significantly increasing since 1994. The observed cooling trend for the city, therefore, may be attributed to the upward trend of SPM in the ambient air, which the city has witnessed, due to increase in urbanization during the last two decades.
What are the possible explanations behind the cooling trend in Pune, different from most large cities including Indian cities like Mumbai and Kolkata? The referred studies give no clear answer to this. The character of Pune as a comparably green city with a lot of shading trees in the streets may be of importance. The location of the weather station in Pune can be located in an area not very affected by urban heat, perhaps located in a park or a rural area within the city. The urban heat effect can be hidden behind a more significant cooling trend, caused by natural climate variations. Without deeper studies there is no real answer.
Even without increasing temperatures in Pune urban heat may be a problem of importance for urban planning. Maximum summer temperatures are sometimes over 40 oC, high enough to cause impacts on health, energy consumption and environment. But the urban heat problem is at least not becoming more important than earlier because of increasing temperatures.
Conclusions
The conclusions are that the average annual temperature in Pune is decreasing between 1900 and 2000 and so are the average annual maximum temperature, average summer temperature and maximum summer temperature. Urban heat island in Pune is not an increasing problem. There is no simple explanation behind the cooling trend in Pune. An UHI effect can be hidden behind a more significant cooling trend, caused by natural climate variations. Urban heat may still be a problem of importance for urban planning. Extreme maximum summer temperatures might cause impacts on health, energy consumption and environment. High summer and maximum temperatures in Pune might cause an increased number of deaths due to periods of extreme heat, but residents of tropic cities like Pune tend to be acclimated to hot weather conditions and therefore less vulnerable to heat related deaths.
4/15/2010

Indian lions and Swedish wolves

Yesterday the Swedish daily newspaper Svenska Dagbladet writes about Swedish wolf population. There are as many wolf pairs that last year despite the wolf hunt, 27 couples. The figures are as yet uncertain, as most the 27 couples gave birth to pups last year or at least 20. Last year 22 couples did multiply. It is also unclear as yet whether there are more wolves than the 210 that the government has determined should be the limit in Sweden. As I have previously stated, it is not a high goal in view of Sweden's sparse population and large surface area. With 210 wolves in Sweden, we have 0.5 wolves per 1,000 square kilometres. Many European countries have 10-15 wolves per 1 000 square kilometres; with this wolf density, we would have 4,000-6,000 wolves in Sweden. In an international perspective, Swedish ceiling of 210 wolves is quite modest. Many other countries also take on responsibility for preserving threatened species. Take for example India, which is one of the world's most densely populated countries. There are a number of big cats which are all endangered, tigers, lions and leopards.
Asiatic lion
Many believe that there are lions only in Africa. But there are 359 Asiatic lions in the wild in Gir forest, a national park in the Indian state of Gujarat. At least that many existed there in 2005. The park is only 1.412 km². It is a small remaining remnant of a tribe that once existed throughout western Asia, and even in Greece, where the extinct around AD 80-100. They were in the Caucasus, Azerbaijan in the current until the year AD 1000. In the late 1800’s lions disappeared from Turkey. The last time lions were seen in Iran was in 1941.
Gir Forest
The Asiatic lion is a separate species, slightly smaller than the African. The strain suffered heavily by inbreeding, the individuals are almost equally closely related to one another as identical twins, but despite this seemingly healthy. The trunk is nearly twice that of the Swedish wolf population, in an area similar to Östhammar municipality in East Sweden. Lion strain decreased slowly until the 1800s when it decreased rapidly because of hunting with firearms. Lion hunting was a favourite amusement among British colonialists and Indian princes. The growing Indian population has turned most of the remainder lived in the jungle for farmland. They are still hunted illegally by peasants who live nearby. A second sanctuary for the Asiatic lion has been proposed in Palpur-Kuno in Madhya Pradesh, where they were prior to 1873 when they were eradicated.
Area of Asiatic linon compared to African lion
The Bengal tiger in India, Bangladesh, Nepal and Bhutan. It is the most frequent tiger species with approximately 2,100 wild animals, of which 1,411 in India, 450 in Bangladesh, 150 in Nepal and 100 in Bhutan. India has around two-thirds of the world's wild tigers tiger reserves in 37 in 17 Indian states. Of the eight species were a hundred years ago, three extinct and only ten percent of the population remains. As late as 2003 there were 3,600 animals. In 2006 all 26 tigers were killed in Sariska Tiger Reserve. Last year reported gone all the tigers in Panna Tiger Reserve. Indian government has now decided to create eight new reserves. But still hunted tigers illegally, around 50-100 tigers are killed each year.
Bengal tiger
India has 1.2 billion people and a population density of 360 inhabitants per square kilometer, compared to Sweden's 23. India is 15 times denser. The Indian challenge is certainly much tougher than Sweden's goal of 210 wolves.

1/11/2010

Iris’ Finnish Turnip Pudding for Christmas

Iris was born in northern Finland and spent her childhood in Turku in southern Finland. Amongst the Finnish traditions she brought with her to Sweden when she married my father in 1935 were Finnish sour rye crisp (Oululaininen) with Finnish Emmenthaler cheese, mämmi, the traditional Finnish Easter dessert, and turnip pudding for Christmas. I have tasted other turnip puddings many times but Iris’ recipe is, so far, superior to all others. Some people make the mistake to include carrot or even potatoes. Forget it. You should only use turnip roots (Brassica Napus).

A Swedish turnip root.
The turnip pudding is mandatory at Christmas in our home. Usually it is eaten together with Christmas ham, but it can stand on its own as well.

The turnip pudding ready for the oven.

This is her recipe

Two big turnip roots or three smaller ones
100 gram margarine
1 dl wheat flour
1-3 tbsp syrup
2 dl milk mixed with cream
1 ml measuring spoon white pepper
A pinch of grated nutmeg according to taste

Cut the turnip roots in cubes. Steam in salted water appr. 30 minutes. Mash the turnip (or use a food processor, but Iris never did). Add the flour, then the other ingredients and mix. Pour in a greased casserole. Smoothen the surface and pour brown dried crumbs on top. Make a nice pattern with a knife on the surface. Bake in the oven, 200 degrees centigrade for one hour.

The turnip pudding baked in the oven.
After I published Iris’ recipe for the turnip pudding on my Swedish blog, I have received several appreciating comments, not only from readers in Sweden, but also from Finland. This is especially honourable, since Finland is the homeland of the turnip pudding.

12/13/2009

History of Tall Buildings

In ancient history high building constructions are well known for example the Egyptian Pyramides. The highest in Giza is 147 m, but they are not regarded as buildings referring to the definition mentioned, but rather monuments.

In modern times the construction technique was not developed for high buildings. During the second half of the 19th century the technique was improved above all through the steel building technique and the invention of the elevator. Several tall buildings were constructed in Chicago and New York. During the 1880’s and 1890’s several buildings of 10-30 floors were constructed in these two cities. The tallest of these exceeded 100 m of height.

Flatiron Building, architect Daniel Burnham, built 1902 and considered to be the oldest remaining skyscraper in New York, 87 meters tall with 22 floors.
In the beginning of the 20th century the tallest buildings had reached a height of more than 200 m and 50 floors. Woolworth building in New York from 1913 was the tallest building in the world for 17 years. World war one and the economic depression forced a pause in the construction of very high buildings, but in the beginning of the 1930’s new record were achieved.

Chrysler building, 319 m, 77 floors, constructed 1930, Architect William Van Alen, both at Manhattan, New York City.
Empire State Building with the roof height of 381 m was the tallest building in the world from 1931 to 1973 when World Trade Center was constructed. When Petronas Tower in Kuala Lumpur, Malaysia with 452 m of height was constructed 1998 the world record left United States for the first time for more than 100 years. Since 2004 Taipeh 101 in the Republic of China is regarded as the tallest house in the world with its 509 m of pinnacle height, though the roof height is actually less than Petronas Tower.

But the world record will soon leave south east Asia for the Middle East when Burj Tower in Dubai in the United Arab Emitates will be finished 2006 or 2007, expected to be some 800 m of height. Reaching these heights some people talk about superscrapers.
During the 1970’s the economic centre of the world started moving towards Asia. At the same time the boom in skyscraper construction started internationally. Shin-juku Mitsui Building in Tokyo from 1974 with 225 m of height was the tallest building in Asia when it was constructed, but this position was soon replaced by other buildings in Japan, South and North Korea, Malaysia, Singapore, the Phillippines, Hong Kong, people’s Republic o China, Republic of China, Thailand and Indonesia. A number of tall buildings have also been constructed in Australia. During the last 20 years South East Asia/Australia has developed to be the new centre of the world for skyscraper construction.
During the last seven years the Middle East lead by Dubai in the United Arab Emirates and Riyadh in Saudi Arabia have joined the club of very tall skyscrapers, and will even take over the world record within a few years. It is still too early to say whether this will be the start of a new chapter in the history of skyscraper construction. The oil and gas resources within the North African and Middle East Region will in any case form good economical conditions for such a future.
For many years skyscrapers were only built in the largest cities in North America. During this period the economic centre of the world moved from Europe to North America. Many large European cities were already developed with high density inner cities before World War One when the construction technique for skyscrapers was developed. After World War Two many more skyscrapers were built in many North American cities but few new height records were achieved.
More than 50 percent, 101 of the 200 tallest buildings in the world, are now located in South East Asia and Australia and 84 of them are in North America. Far behind follows Middle East with 9 and Europe with only 6. None of the 200 tallest are located in Africa or South America.

II International Finance Centre, Hong Kong, People’s Republic of China. 415 m, 88 floors, constructed 2003.
The tallest building in Asia is Taipei 101, 509 m, in North America Sears Tower, 442 m, in Chicago, from 1974, in Australia Q1, Queensland, 323 m from 2005 and in Europe Triumph Palace, Moscow, 264 m from 2004. The tallest building in Africa is Carlton Centre Office Tower, Johannesburg, South Africa, 223 m high and 50 floors and constructed 1973. The tallest buildings in South America are the two skyscrapers Parque Central Torre Este and Parque Central Torre Oeste in Caracas, Venezuela, both 221 m high and 56 floors built 1979 and 1984 respectively.
United States still has the country record with 79 of the 200 highest buildings in the world but the People’s Republic of China is following closely with 49 buildings, Hong Kong included. The four most skyscraper dense cities in the world are New York (27 of the 200), Chicago (12), Hong Kong (17) and Shanghai (12). Dubai has already six buildings among the 200 tallest, all of them built since 1999.
There are no buildings in Africa among the 200 tallest in the world. As mentioned, the tallest building in Africa is Carlton Centre Office Tower, Johannesburg, South Africa, 223 m high and 50 floors and constructed 1973. Twelve of the 25 tallest buildings in Africa can be found in South Africa, eleven in Egypt and one each in Kenya and Zimbabwe. They are all higher than 130 m and most of them have 30-50 floors.

Citic Plaza, Guangzhou, People’s Republic of China, 391 m, 80 floors, constructed 1997.

Shun Hing Square, Shenzhen, People’s Republic of China, 384 m, 69 floors, constructed 1996.
Since 1970 there has been a skyscraper boom internationally. Of the 200 tallest buildings only 15 were built before 1970. And the trend is accelerating. Of the 200 tallest 19 were built during the 1970’s, 33 during the 1980’s and 59 during the 1990’s. Not less than 74 of the 200 tallest buildings – one third - have been constructed during the six years after 2000. The trend of constructing more and more very tall buildings is obvious internationally.
Even if the building technique made it possible to construct skyscrapers it is not a reason enough to actually build them. In New York and Chicago, where the trend started the high demand for land in the central parts of the cities made the land price increase to levels that demanded a more intense land use, and the urban planning gave no restrictions for such a land use.
The tall houses are also considered as famous trade marks for the companies that built them, like Woolworth building, Chrysler building and Sears Tower. More and more the tall buildings have become not only symbols for the company that once built them, but also for the city itself. But the more skyscrapers built around the world the harder competition to achieve these symbolic values.

11/07/2009

How dense are dense cities?

I am often talking about densification of cities as a way to avoid urban sprawl, achieve both economic and environmental goals and at the same time attain a more attractive city for the inhabitants and visitors. But how dense are actually dense cities? Few large cities have a higher density than 10,000 persons per square km as long as we talk about the whole urban area. This is for example the case for Asian cities like Mumbai, Delhi and Seoul. Seoul with 12 million persons on an area of 605 square km, and a population density of 17,000 persons per square km, is really a very dense city. Paris is a European city of very high density, at least in the central parts. The density in the city of Paris, an area of just 87 square km, is actually as high as 25,000 persons per square km. For the metropolitan area of Paris, the density is only 3,500 persons per square km however. Cities with a population density of 2,000 persons per square km for the urban area could hardly be regarded as dense, but those cities usually have a higher density in the core area. A number of these cities have a density of approximately 6,000 persons per square km. Stockholm has a population density of 4,200 persons per square km in the administrative city and 3,300 persons per square km in the urban area. The density in the inner city however is 8,200 persons per square km, and in the densest parish, Maria (where I happen to live), density is as high as 24,000 persons per square km, same as in Paris. But this is a very small parish with a population of only 20,000 persons compared to Paris with more than 2 million. Hundred times as big, but with the same density. Central parts of Stockholm.
American cities are well known for urban sprawl and low density. But New York City is actually quite dense. New York City has a population of more than 8 million and a density of 6,800 persons per square km. The maps of Central part of Stockholm (above) and Manhattan in New York (below) are in the same scale for comparison (maps from Google Earth). Central parts of Manhattan, New York City
Pune is an Indian city in the state of Maharashtra south east of Mumbai. Pune has a population 2007 of approximately 3.2 million persons within the administrative area and a population exceeding 5 million in the metropolitan area. The central parts of Pune are shown on the map (below) at the same scale as Stockholm and New York City. Central parts of Pune, Maharashtra, India

The average population density in Pune in 2007 is estimated to approximately 12,000 persons per square km. The density will most likely exceed 20,000 persons per square km., in 20 years from now. One conclusion is that dense cities is not only a question of density, but also a question of size.